
🧭 How I Found My Edge by Solving the Fallacy of the Dog Pack
How rethinking data, edge, and the illusion of “more analysis” led me to build a system that turns market noise into structure.

Everyone in trading talks about having an edge. Few can define it, and even fewer can prove it. What most call “strategy” is often just noise dressed up as insight. My own edge didn’t emerge from a secret indicator — it came from understanding a fundamental fallacy that traps almost every analyst who looks at price data.
#1 Defining the Edge
Every trader eventually confronts the same question: What is your edge?
What enables you to extract money from the market repeatedly — across regimes, volatility cycles, and sentiment shifts?
Most market participants don’t truly own their edge; they rent it. They follow an advisor, subscribe to a newsletter, or invest in a fund. But if you don’t know what your edge is, you’ve likely become someone else’s edge — a source of liquidity for a player who does.
And let’s be honest: you won’t find a genuine shark selling subscriptions for $19.99 a month.
True sharks don’t monetize knowledge through small retail offerings , the charge “2 & 20” fee structures. At best, you’ll encounter a seasoned barracuda. More often, though, it’s Nemo in a shark costume — loud on performance claims, quiet on substance.

#2 The Fallacy of the Dog Pack
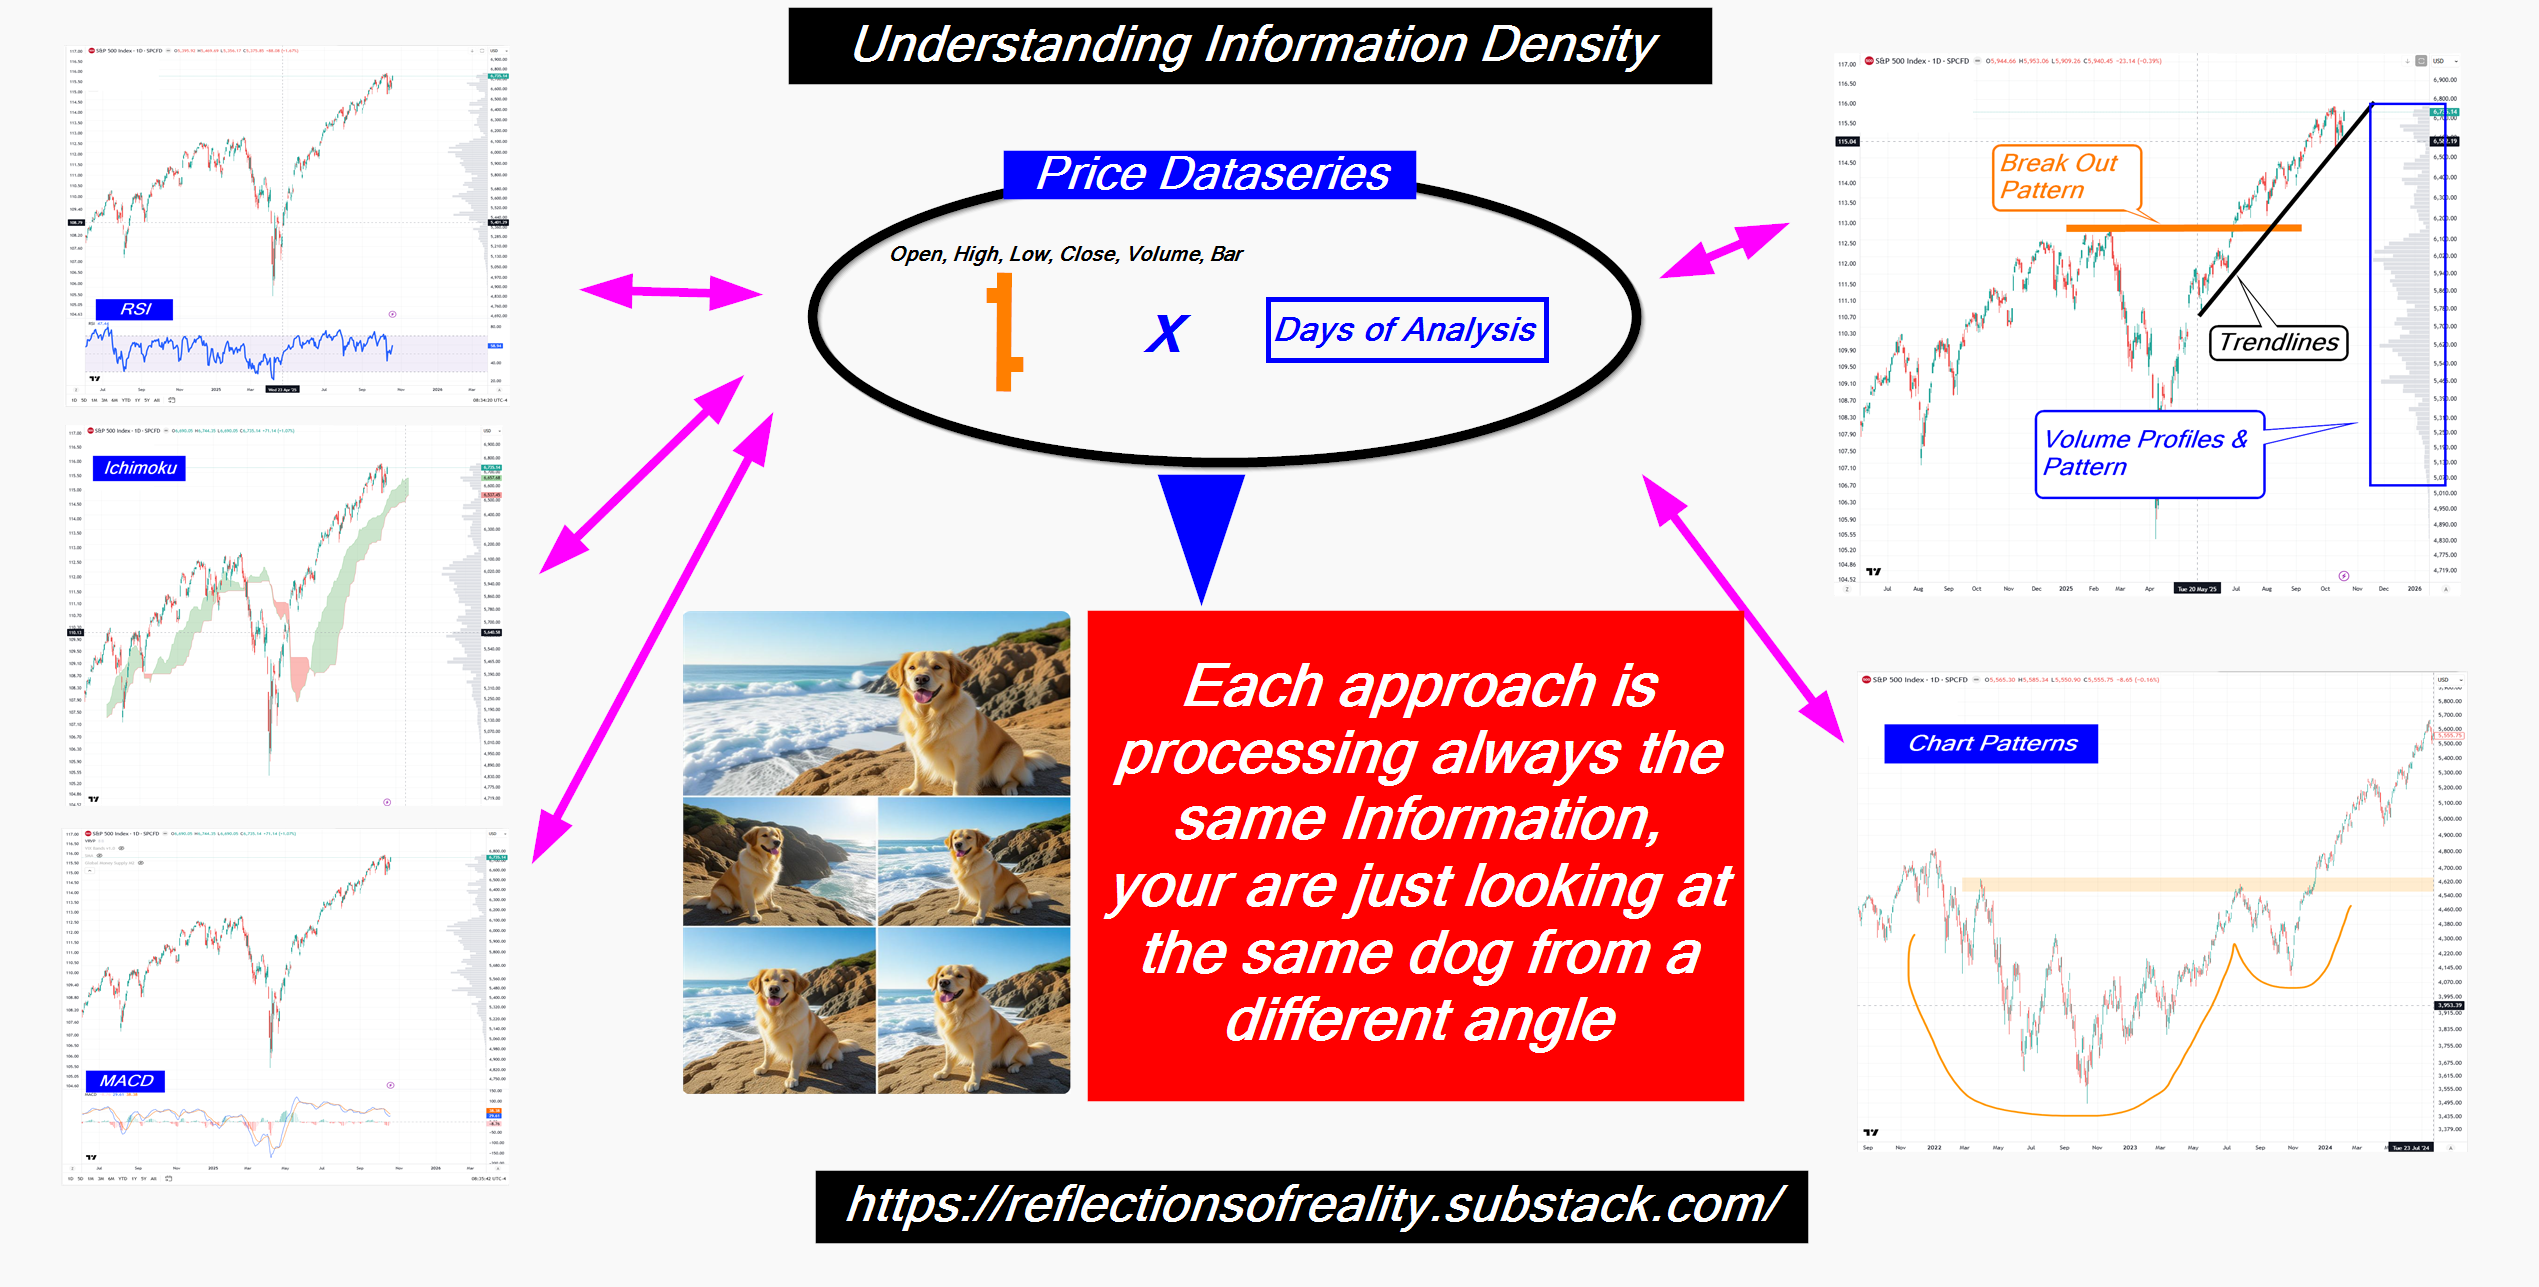
When you move beyond fundamentals, every analytical approach — whether it’s technical indicators, chart patterns, or quantitative filters — eventually converges on the same raw material: price data.
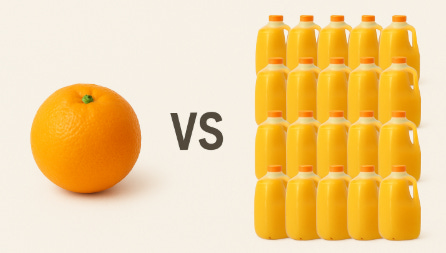
Open, High, Low, Close, and Volume — that’s the full orange 🍊.
The information contained within that dataset is finite. No matter how many indicators you apply, you’re still squeezing the same orange.
Yet many traders fall for what I call the fallacy of the dog pack: believing that using multiple analytical lenses produces a broader view. In reality, it doesn’t. You’re not observing a pack of dogs — only the same dog from different angles. The data hasn’t changed, only your framing has.
#3 Expanding the Data Horizon — More Oranges 🍊
Recognizing the limits of price data, professionals have long sought to expand their informational base — adding breadth via correlated tickers, sentiment indices, or Commitment of Traders (CFTC) data.
Pioneers like SentimenTrader understood early that edge scales with data diversity.
The emergence of the modern derivatives market, especially in listed options, fundamentally altered that landscape. Suddenly, the market offered new, behavioral datasets: implied volatility surfaces, dealer positioning, gamma exposure, and flow dynamics.
Innovators like
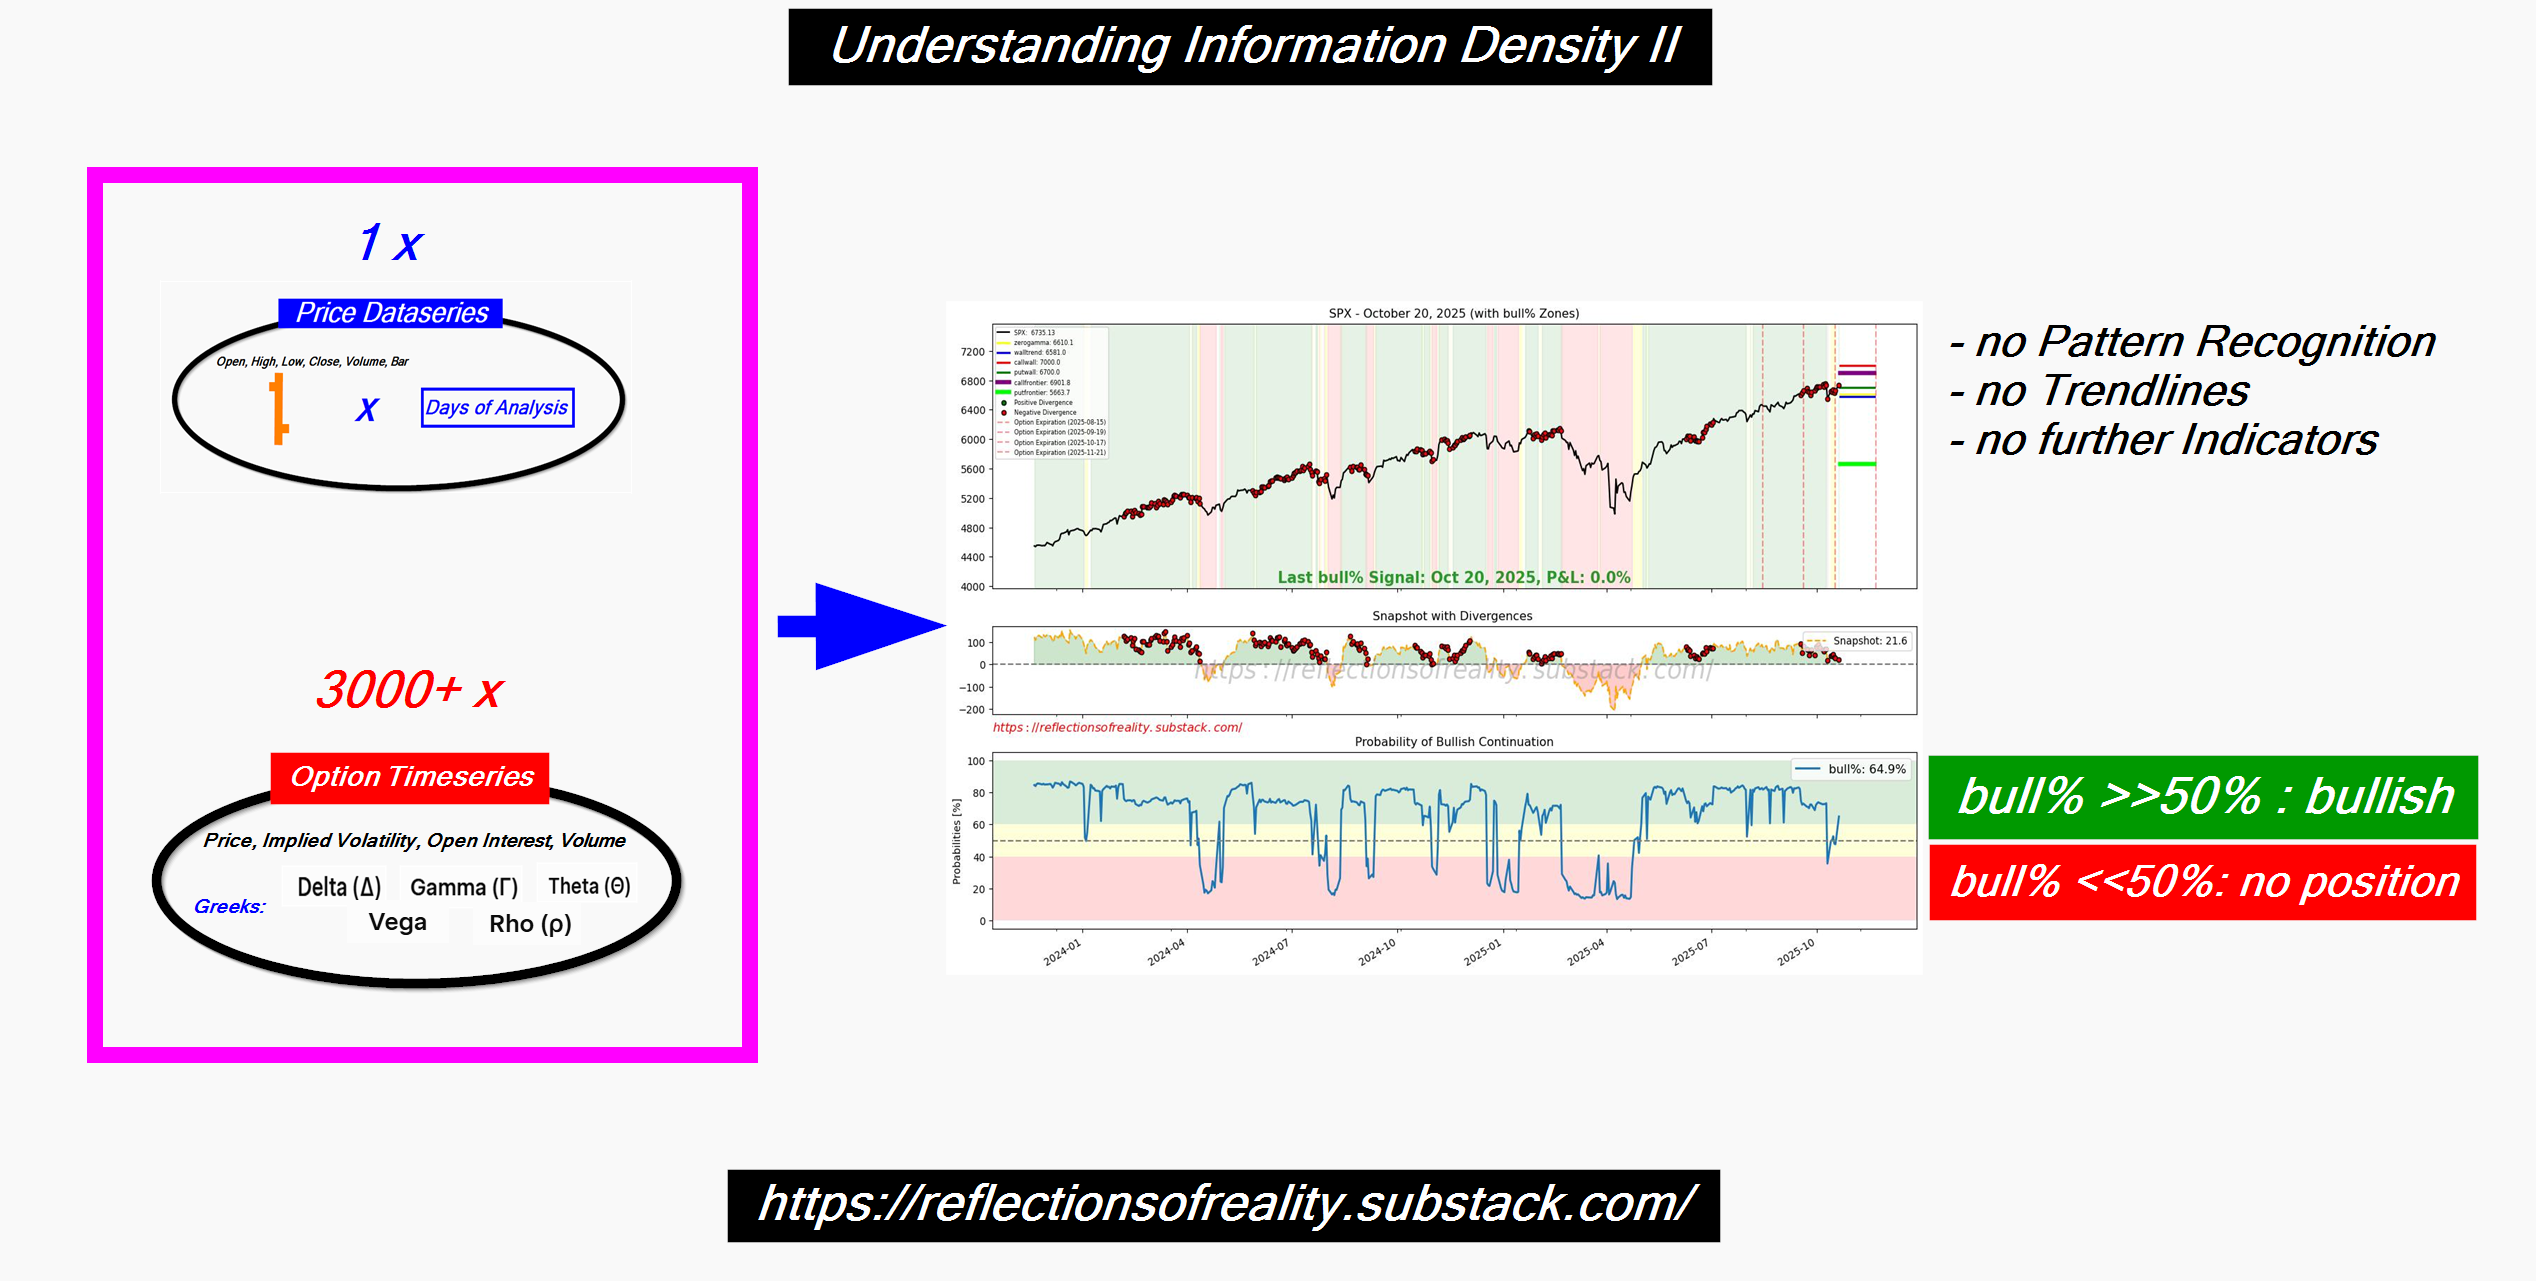
The shift is profound. Instead of squeezing one orange, you now have gallons of juice to analyze.
But with that abundance comes complexity — you need industrial machinery: mathematics, computation, and automation. You inevitably lose some of the visual simplicity of a trendline, but what you gain is information density and precision.
#4 Industrial Juice: The Bull %
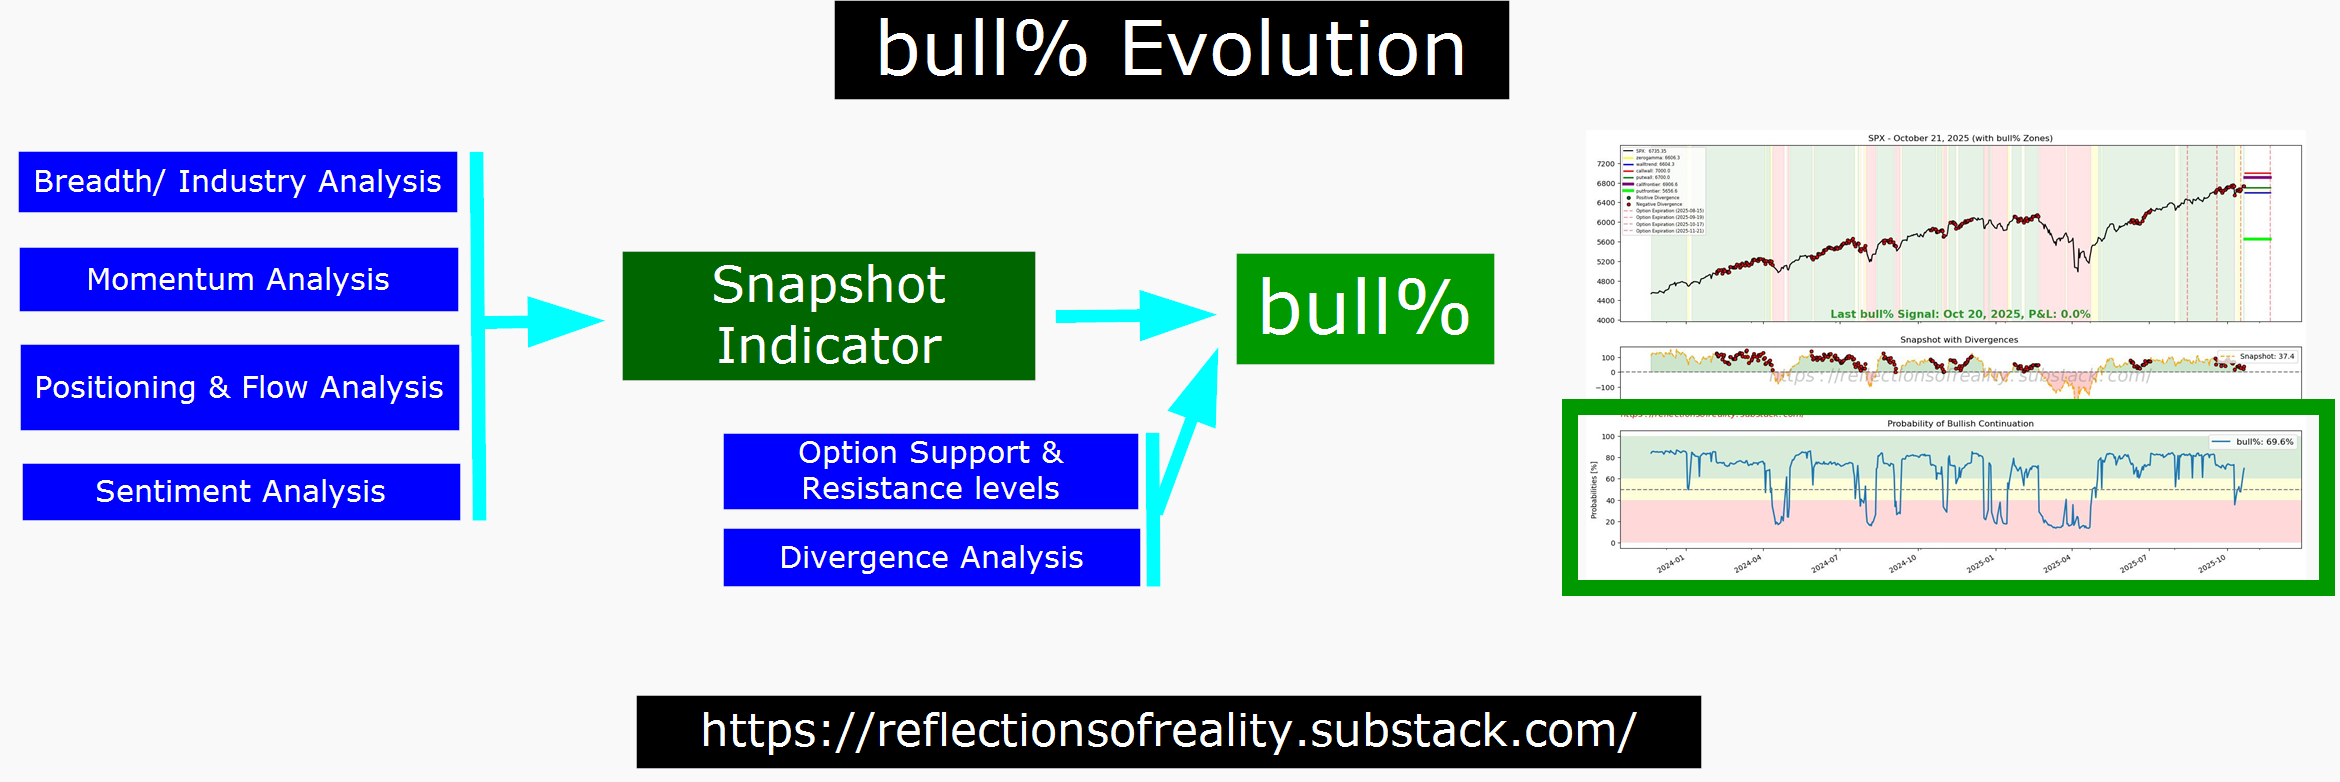
From this industrial process emerges a single, distilled metric — our Bull %.
It’s the quantified result of aggregating vast layers of market data into one interpretable signal. The power of the Bull % lies not in its formula but in its compression: the ability to represent millions of data points in a single, actionable number.
The outcome is elegantly simple.
We translate the Bull % into intuitive color codes — green for strength, red for weakness — and anchor our tactical bias on one guiding rule:
When Bull % ≫ 50%, the benefit of the doubt belongs to the bulls.
This simplicity on the far side of complexity is what defines a true edge:
Data-driven, deeply engineered, yet human in its clarity.
Closing Reflection
Finding this edge reshaped how I see markets — and, more importantly, how I see analysis itself. The goal was never to build a system that knows more, but one that understands better. In the end, every serious trader learns the same lesson: the edge isn’t in the chart, or the model, or the data — it’s in how you transform noise into structure and complexity into clarity. Once you see that, the market stops feeling like chaos and starts behaving like a language you can finally read.
❤️ Support our Work
📢 Stay Connected & Support
We provide intra-week updates via:
🔔 Substack Notes
💬 Community Chat
Renaissance...that quite a comparison. I'd hang it a notch lower :)
The implementation of the idea isn’t exactly simple, though, as you have to deal with mountains of data
Couldn't agree more. Your distinction between renting and owning an edge is spot-on. Could you elaborate further how the "dog pack" fallacy specifically misinterprets the 'full orange' price data?