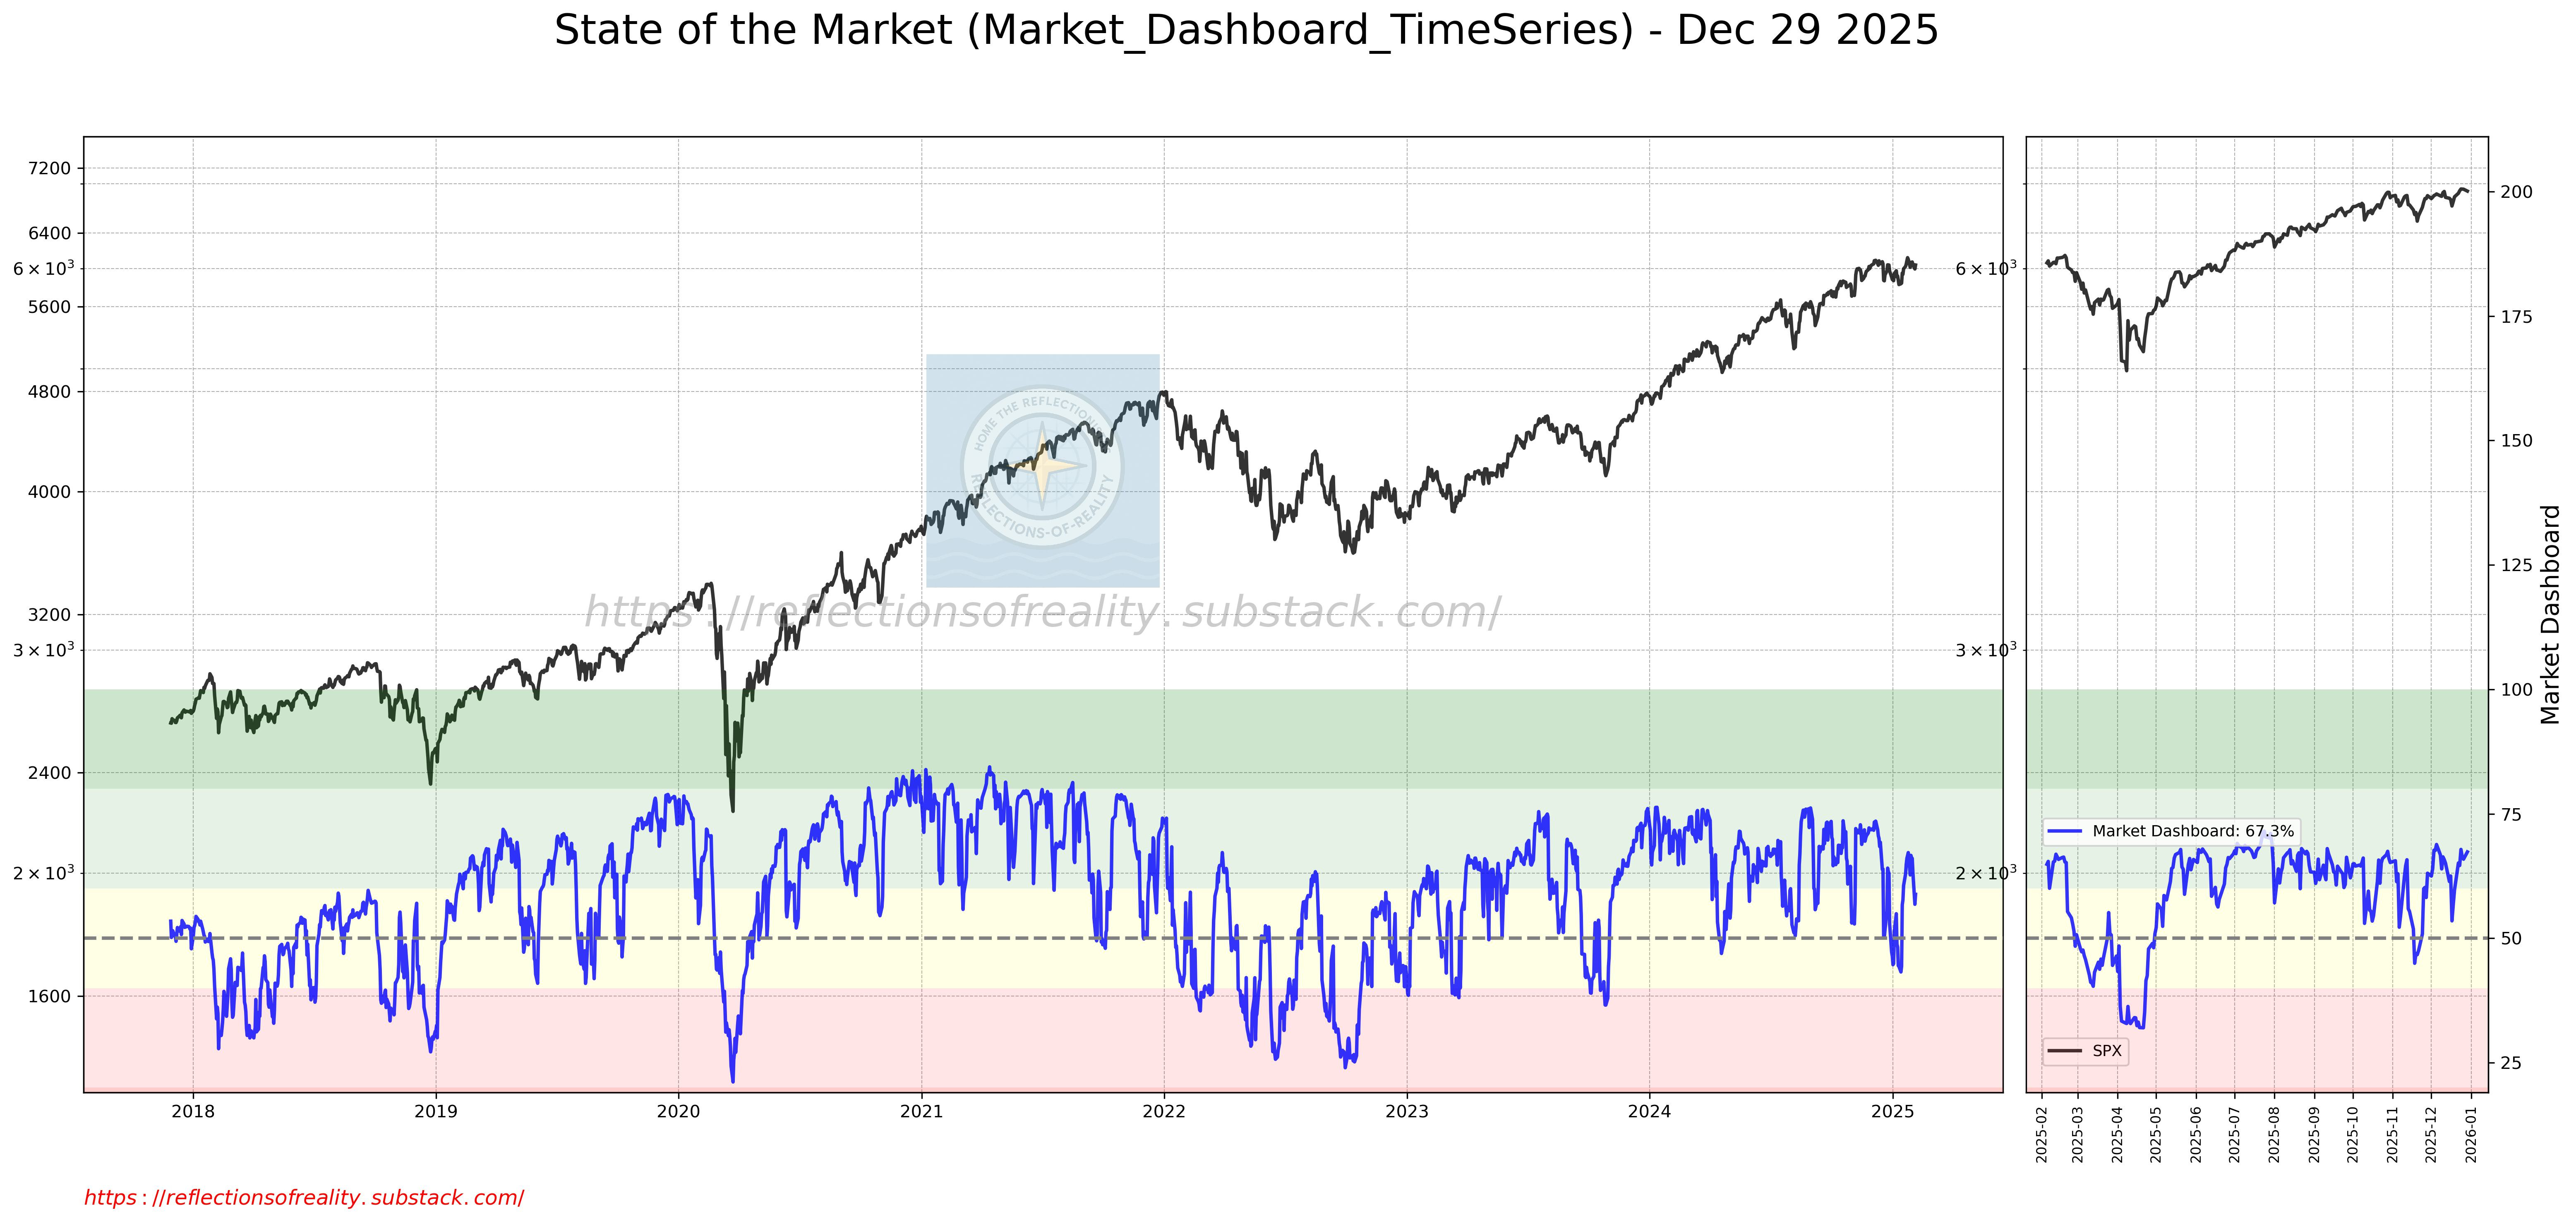
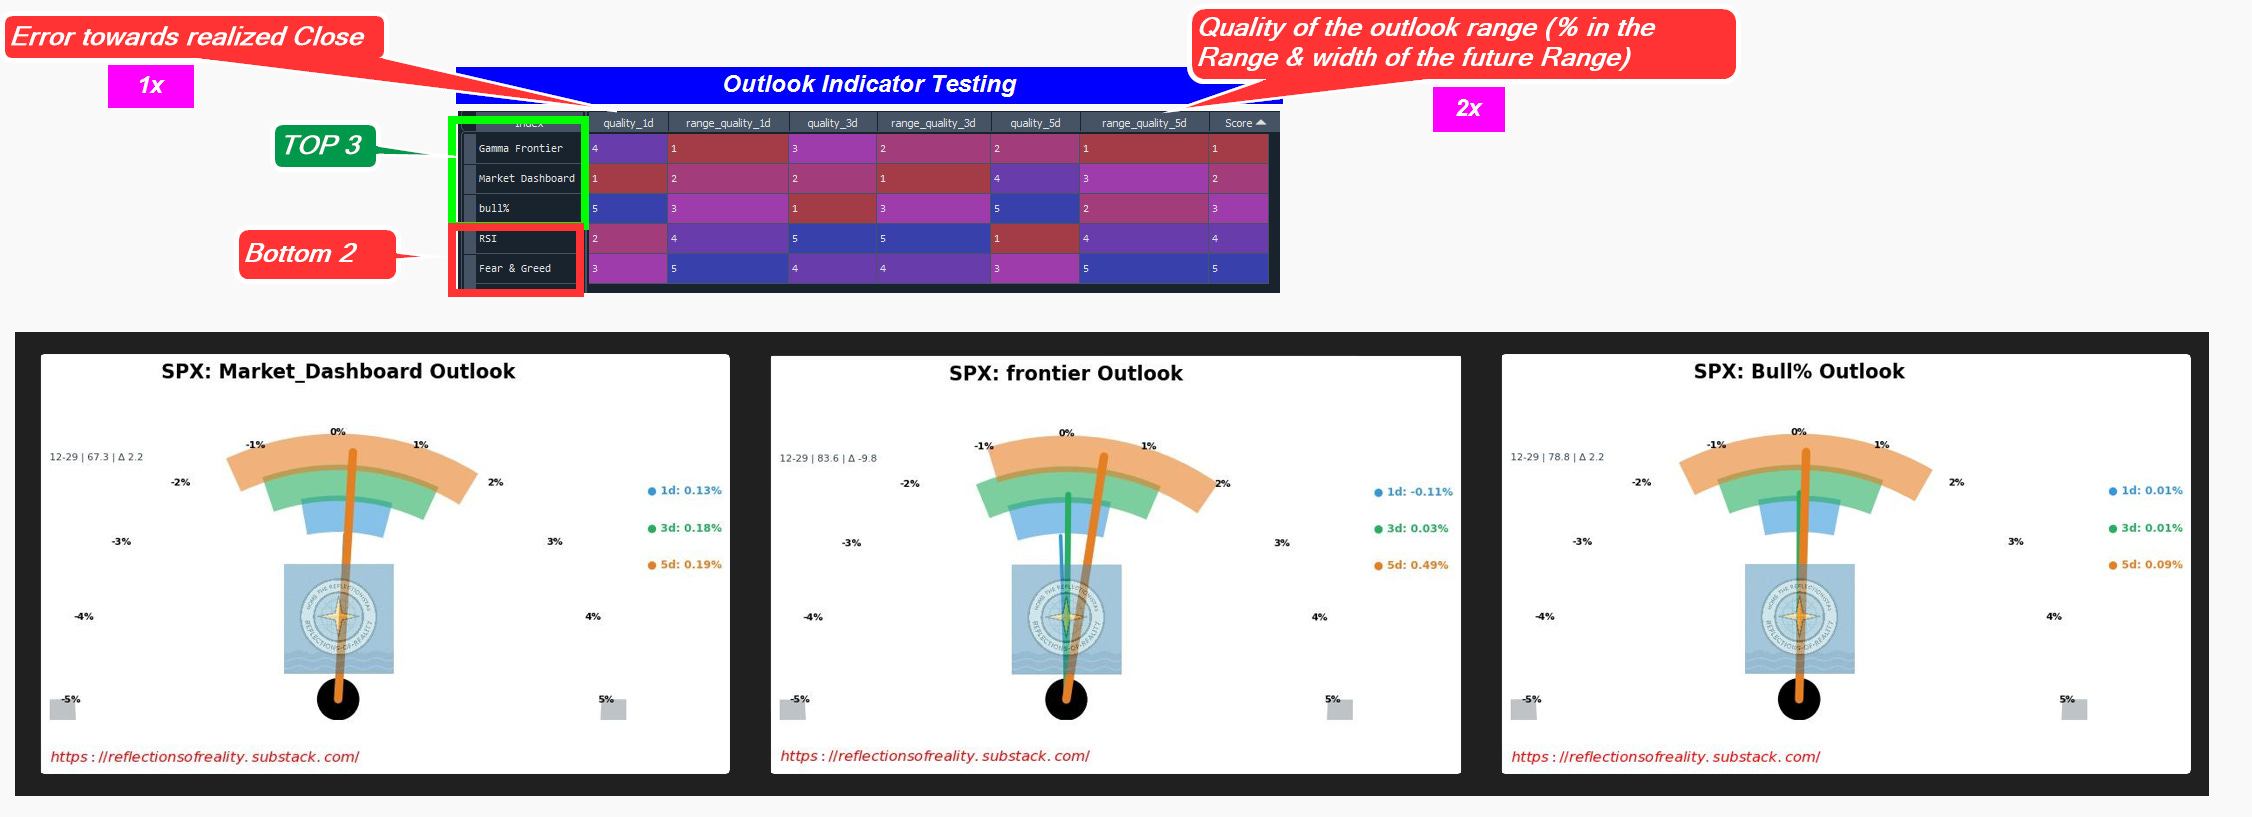
Short-Term Outlook Indicators (1–5 Day Horizon)
Following our post
👉 Introducing the 1–5 Day Bull% Outlook
we took a deeper dive into which indicators exhibit the strongest short-term prognostic power for the S&P 500 over a 1–5 day horizon.
What we tested
We evaluated several indicators across identical forward windows, focusing on two core quality KPIs:
Directional & price accuracy
How close is the forecast to the realized 1-, 3-, and 5-day SPX close?Range quality & volatility projection
How precise is the projected forward range—both in terms of containment (% of outcomes inside the range) and range width?
(Tighter ranges with high containment score higher.)
To provide proper context, we ran the same framework on:
RSI
CNN Fear & Greed Index
and compared them against our proprietary indicators:
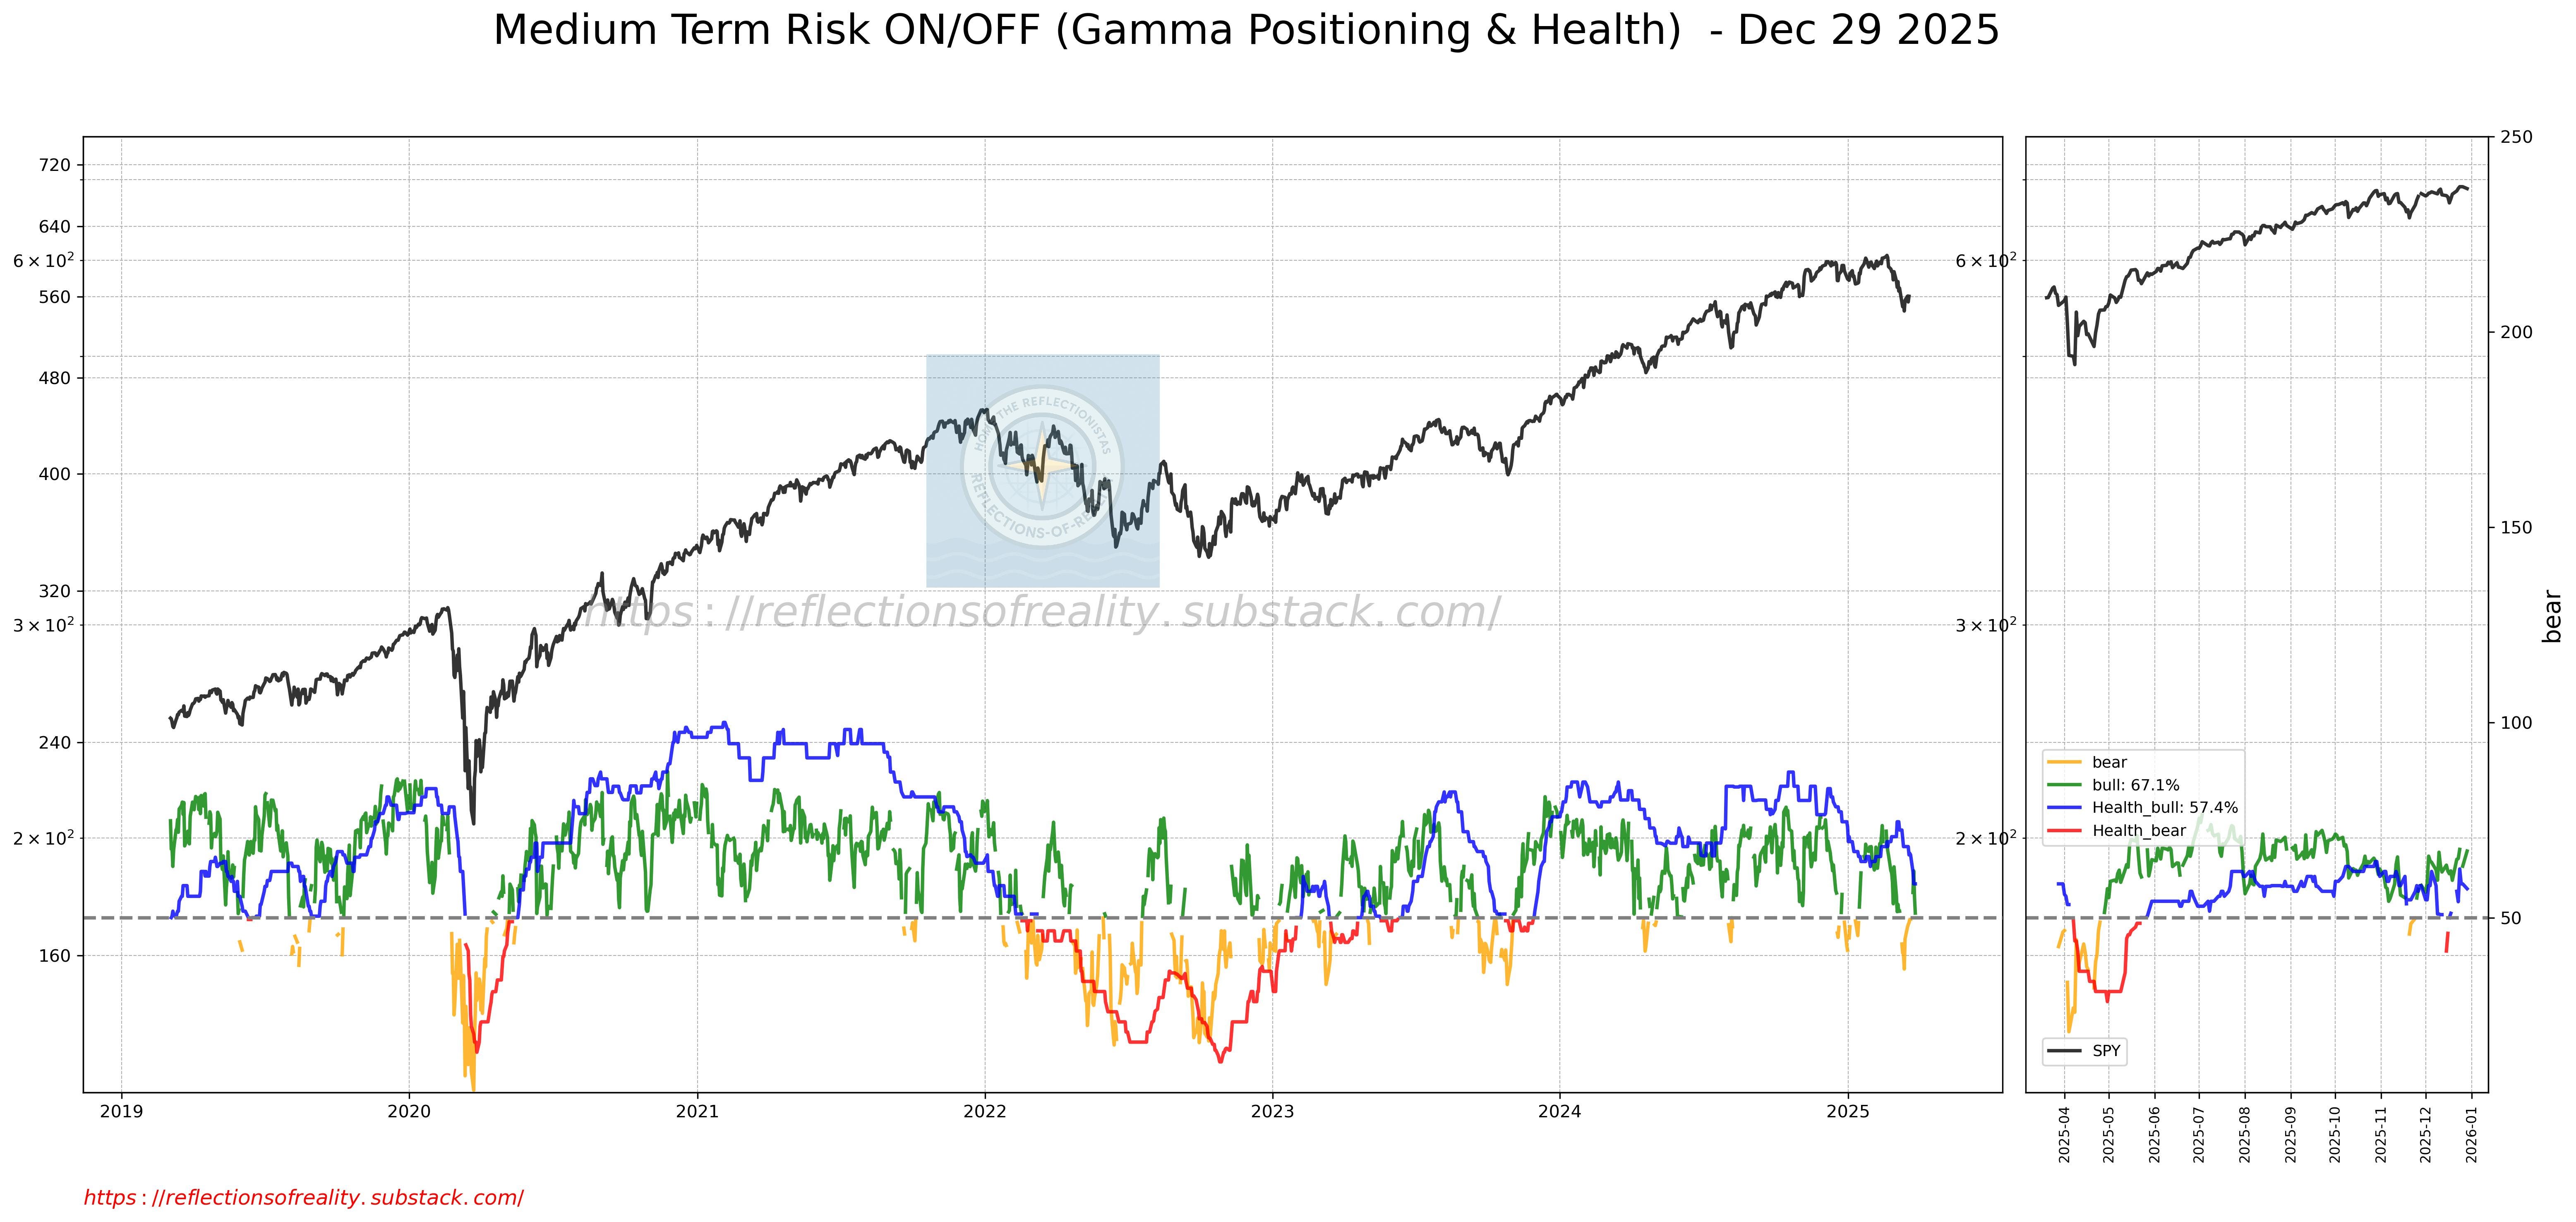
Gamma Frontier
Market Dashboard Index
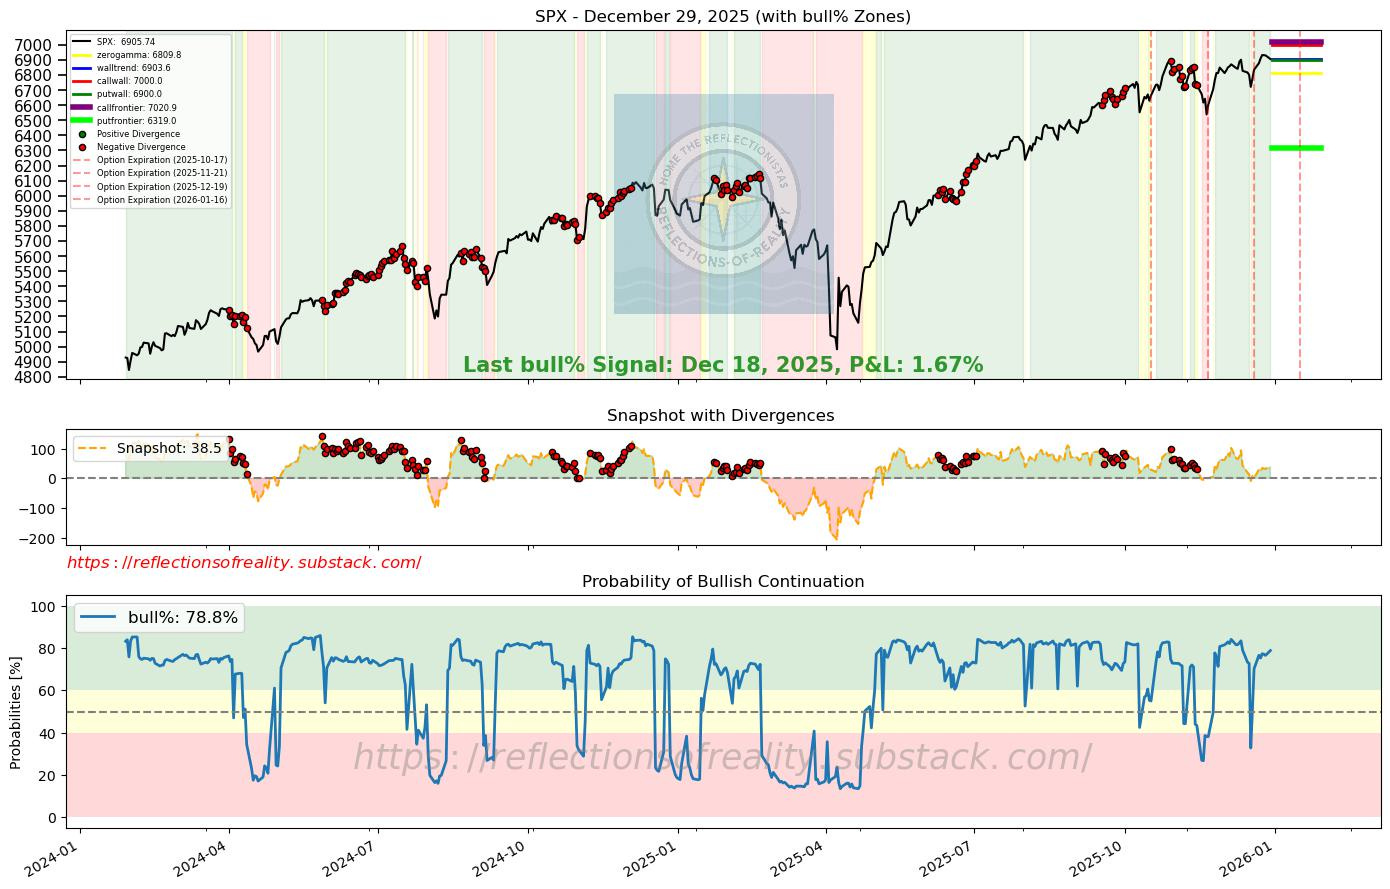
Bull%
Results at a glance
Top performers:
Gamma Frontier, Market Dashboard Index, and Bull% consistently ranked at the top across both KPIs.Bottom performers:
RSI and CNN Fear & Greed lagged in directional accuracy and overall score.Range behavior:
All indicators produced reasonably tight forward ranges, but our proprietary toolbox showed superior balance between precision and containment.
Conclusion
Our proprietary indicator suite outperforms RSI and CNN Fear & Greed in short-term (1–5 day) SPX forecasting.
All tested indicators generate usable volatility ranges,
Forward focus:
Rather than relying on a single signal, we will increasingly look for multi-indicator alignment to further increase probabilistic edge.