
Survive Alone or Don't Ship
Part three of three. The standard, the laws — and now the receipt.
Two days ago I made two claims and left one thing unproven.

In I Can Show You the Stars I argued that behind every beautiful equity curve there are only three numbers — Sortino, Calmar, and max drawdown measured against the thing you’d have owned instead. Calmar is the one you’re actually buying, because it barely moves when you add leverage. Everything downstream is a dial. The Calmar has to be there first. It’s the launch pad, not the rocket.

In The Ten Wisdoms of the Baro Protocol I carved out the laws. Don’t trade against the Dashboard above 50. Carry portfolio insurance. Rotate in accumulation. When the Risk Appetite of the Seasons rises above zero, the bull has a floor.
Here’s the problem with commandments: they are only as good as the instruments they point at. Wisdom III is worthless if the Dashboard is noise. Wisdom VII is worthless if risk appetite above zero means nothing. Ten beautifully written laws predicated on bad indicators is just astrology with better typography.
So we hold every instrument to one deliberately brutal test: it has to survive alone.
Strip away the context. Strip away confirmation from the other three. Wire the indicator directly to a single trading trigger — long when it says yes, no discretion — and it must clear Calmar > 1.0 entirely on its own. That is the qualifying threshold, and it is not negotiable. One year of return for every unit of hole you had to sit in — below that, an instrument is not paying for the pain it costs. Nothing here is allowed to be “colour”, or “context”, or “one input among many”. If it cannot carry a portfolio by itself, it does not get to influence one.
That standard kills most ideas, and it is supposed to. An indicator that only works when three other things agree with it isn’t an indicator — it’s a decoration on a decision you’d already made.
So this post is the audit. Same three numbers from Part One, applied to the instruments the Ten Wisdoms depend on — each one run as a standalone system, on its own, with nowhere to hide.
The bar, and who clears it
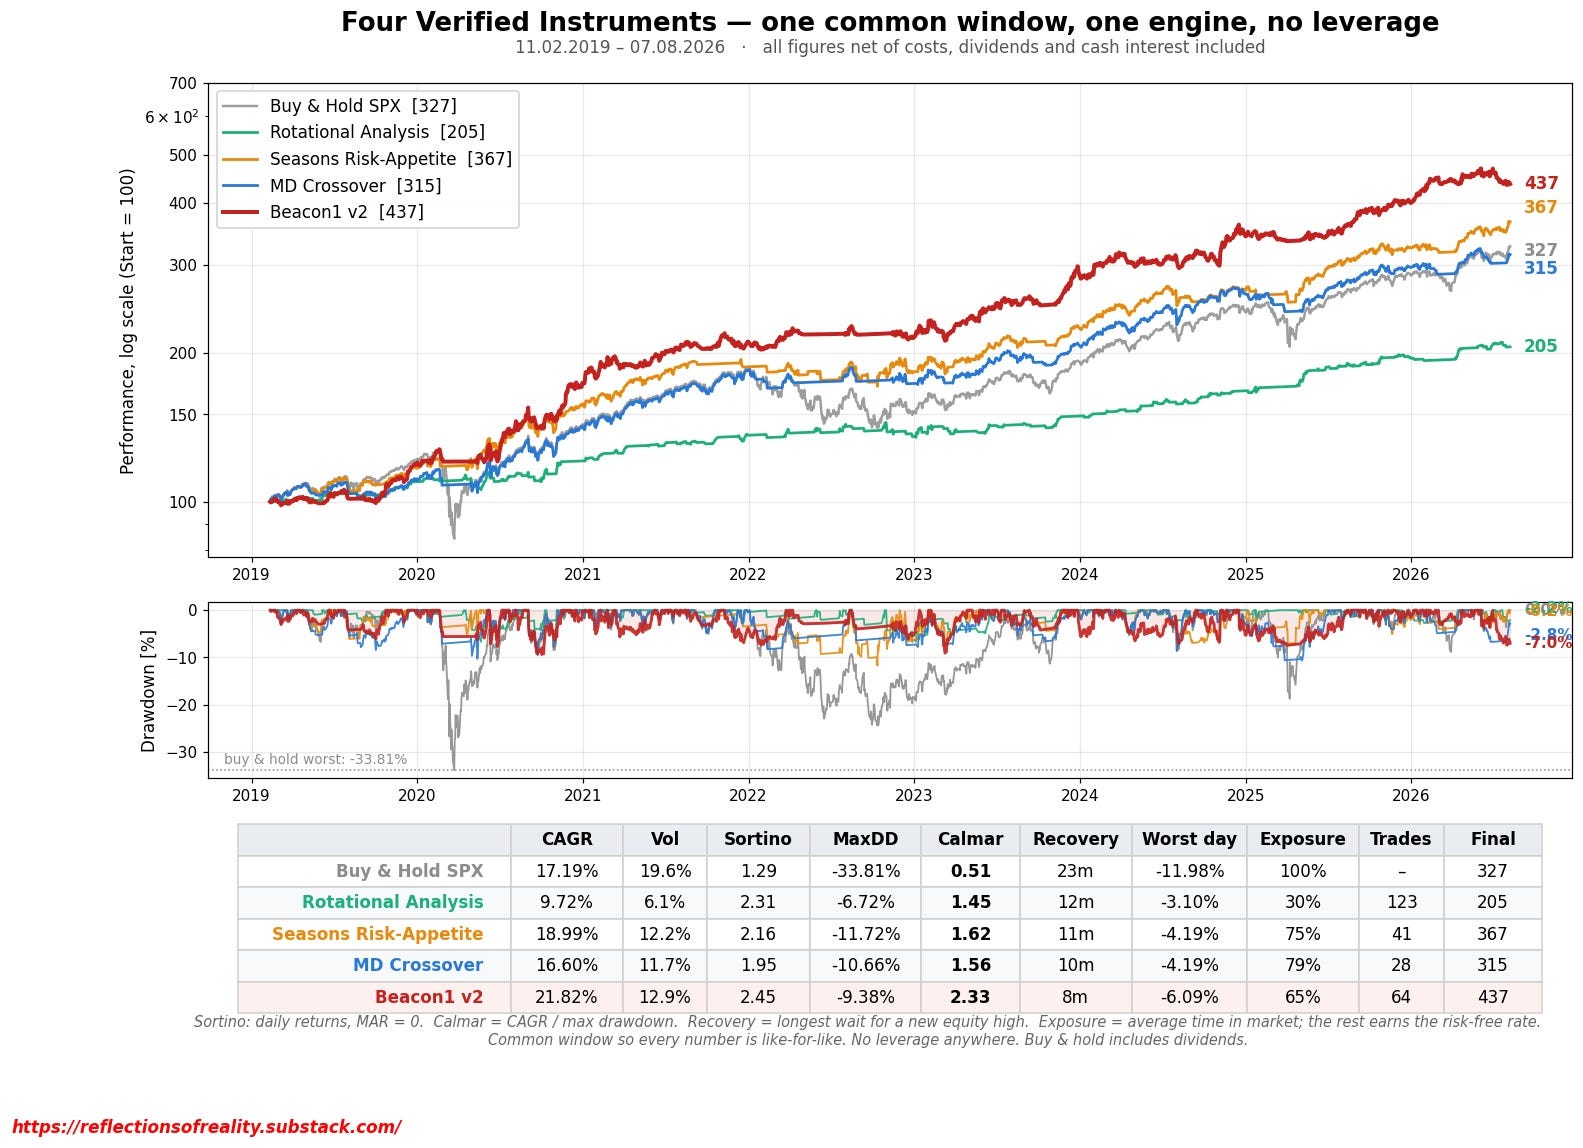
Common window, 11.02.2019 – 07.08.2026 — the same dates as the Beacon leverage study in Part One. Same engine, same cost model, dividends and cash interest included, no leverage anywhere.
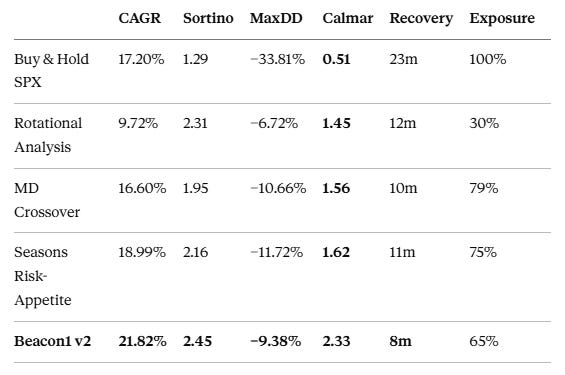
Two notes so the numbers reconcile with Part One. Buy and hold here includes dividends — 327 rather than the 286 on the leverage chart — which raises the bar every instrument has to clear, from Calmar 0.45 to 0.51. And Sortino is on the MAR = 0 convention, as in Part One.
Every instrument clears buy and hold’s 0.45. Three of them roughly triple it.
Every instrument clears the 1.0 qualifier, and every instrument clears buy and hold’s 0.51. All four roughly triple it or better, and every one of them does it while holding less than the index — Rotational at 30% exposure, Beacon at 65%.
Then apply the rule from Part One: levered max drawdown must stay under half of buy & hold’s — call it 17%. Unlevered, all four sit at −6.7% to −11.7%, so each has genuine headroom. Beacon runs out around 1.8x, exactly as Part One found. Seasons, at −11.72%, runs out around 1.45x. The dial exists. We still don’t turn it — but the point of Part One was that you should know how much room you have before you decide not to use it.
What each instrument is actually for
Clearing the bar earns a place. What an instrument is good at determines its job.
Rotational Analysis — indicator. Wisdom IX: rotate in accumulation, and the correction shall pass over thy house. In the market under a third of the time, worst drawdown −6.72% — a fifth of the index’s. The most reactive of the set, 123 trades at a 4-day average hold, and the second-highest Sortino of the four. It tells you where the seller is exhausted.
Seasons Risk-Appetite — indicator. Wisdom VII: when the Risk Appetite of the Seasons riseth above zero, the bull hath a floor. Tested, and the floor is real: 18.99% against the index’s 17.20%, with roughly a third of the drawdown — the only instrument here that beats buy and hold on raw return as well as on risk.
MD Crossover — portfolio insurance. Wisdom V: thou shalt carry Portfolio Insurance, for the drawdown cometh in the hour thou dost not expect it. Calmar 1.56, but the number that earns it the insurance role is the ten-month worst recovery — shortest of the four bar Beacon itself. Twenty-eight trades in seven and a half years, wrong more often than right, winners several times the size of the losers. Insurance shouldn’t fidget. This doesn’t.
Beacon1 v2 — Wisdom I in practice. The TriplePlay is thy Northstar. Selection driven by the verified indicators, paired with MD Crossover as insurance. Calmar 2.33, Sortino 2.45, −9.38% worst drawdown against the index’s −33.81%, eight-month recovery against twenty-three. These are the same figures Part One levered to the Reg-T ceiling — this is where they come from.
Beacon doesn’t out-earn its parts by finding a better signal. It earns more by losing less and compounding from a higher base. Look at the drawdown panel: 2020, 2022, 2025 — the grey line goes to the floor three times; the red line barely leaves the top band. That gap is the whole thesis.
Where the audit corrected us
Two findings worth reporting, because a test you always pass isn’t a test.
The eye-catching part of the Seasons chart is the wrong part. The green “TREND-FRIENDLY” band above +30 is labelled as fuel for a trend. Across every configuration tested, waiting for +30 selected days that underperformed simply being invested. By the time all four regimes have resolved that far in the growth direction, the move has been paid out.
Which — read carefully — is what Wisdom VII already said. When it entereth the Trend-Friendly zone, the bull walketh slowly, and thou shalt walk slowly with him. The zone was never a buy signal. It was a tempo instruction. The sin named in that wisdom is trading a slow bull quickly, and the backtest just put a number on the cost of that sin. The chart’s own label was more optimistic than our own law.
One finding died. During this work a striking result appeared: within MD Crossover’s long days, the index returned 30.5% annualised while risk appetite was below +30, and 10.3% while above. A twenty-point gap with a tidy late-cycle explanation attached.
It didn’t survive. Comparing two buckets of ~775 daily returns carries a standard error near fourteen points, so a twenty-point gap sits 1.4 standard errors from zero — around p = 0.07 to 0.11. We planted a deliberate 20% effect in synthetic data and the same method recovered only 10.3 points, confirming it can’t resolve differences of this size. Discarded.
It’s reported here because a plausible story attached to a marginal number is more dangerous than no story at all. That’s the failure mode this whole series exists to guard against.
The series, in one line each
Part One gave you the standard: three numbers, and Calmar tells you whether it’s an edge or a dial.
Part Two gave you the laws: what to do when the instruments speak.
Part Three is the receipt. Every instrument the laws depend on, measured against that standard, on one common window, with the failures shown alongside the passes.
No chart reading. No discretionary overrides. No this time the setup looks different. Every instrument here is a rule that can be written down, run by anyone with the same data, and checked against the same numbers. Every figure comes out of a database logging each trade, each stop, each exit reason, each day’s exposure. Re-run it tomorrow and you get the same answer, because nothing in it depends on judgement.
That constraint costs us. It means binning findings that look good, and admitting the honest sample is seven and a half years and one instrument rather than the eternal truths a backtest can be made to imply.
But it’s the only thing that makes the Eleventh Wisdom possible. The Protocol works when you follow it on the days you do not want to. You cannot hold the line against your own conviction on the strength of a hunch. You can only do it on the strength of something you’ve verified.
Repeatable. Verifiable. Or it doesn’t ship.
Charts and full metric tables: Rotational Analysis, Seasons Risk-Appetite, MD Crossover and Beacon1_v2, common window, unlevered.