Why the Implied Correlation Index is the new VIX
Yesterday we posted…

…and a question came up why this is so important?
The simple reason is that the market structure has materially changed with the advent of the dominance of passive investing.
Implications of passive investing
over the last decade we see an explosion of passive investing. This is your
monthly ETF savings plan
corporate retirement savings plan
“target day funds” (age related pension investment schemes)
etc.
Every months the Blackrocks of the world have to invest billions in index related products (ETFs etc.) at the beginning of the month
These investments are automatic investments irrespective of any valuation considerations
The key metrics are the weights in the indices. If you have a AAPL, TSLA or NVDA with high weightings, Blackrock will buy those stocks for you in volumes
This results in a positive drift in the market with outsized effects for the larger cap. names for stock & index prices
This furthermore results in a downside drift in the VIX (Volatility Index based on S&P500 options)
The passive flows are estimated in excess of 40+% of all stock investments
The more capital flows into index related products, the more yield enhancing (like call overwriting) strategies arise
If speculators know that there is strong recurring bid in those larger cap names from all the passive investing, they will try to capitalize on these effects by speculating outright on these individual names (like the Gorillas)
Why the Implied Correlation Index is the new VIX
In the past investors looked at the VIX as a risk measure. The downside drift coming from the passive investing has watered down the qualities of this risk gage.
The implied correlation zones
green zone:
bearish market sentiment
the correlation of the implied volatilities is high (low in our inverted graph)
ideally the VIX is high (low in the graph), meaning hedging is expensive because of high risk
market paticipants are willing to pay dearly for hedges on the indices and single stocks
red zone:
bullish market sentiment
the correlation of the implied volatilities is low (highin our inverted graph)
massive call overwriting which leads to low Index vola
massive call buying in single stocks which leads to higher realtive volas
Euphoria
orange zone:
neutral
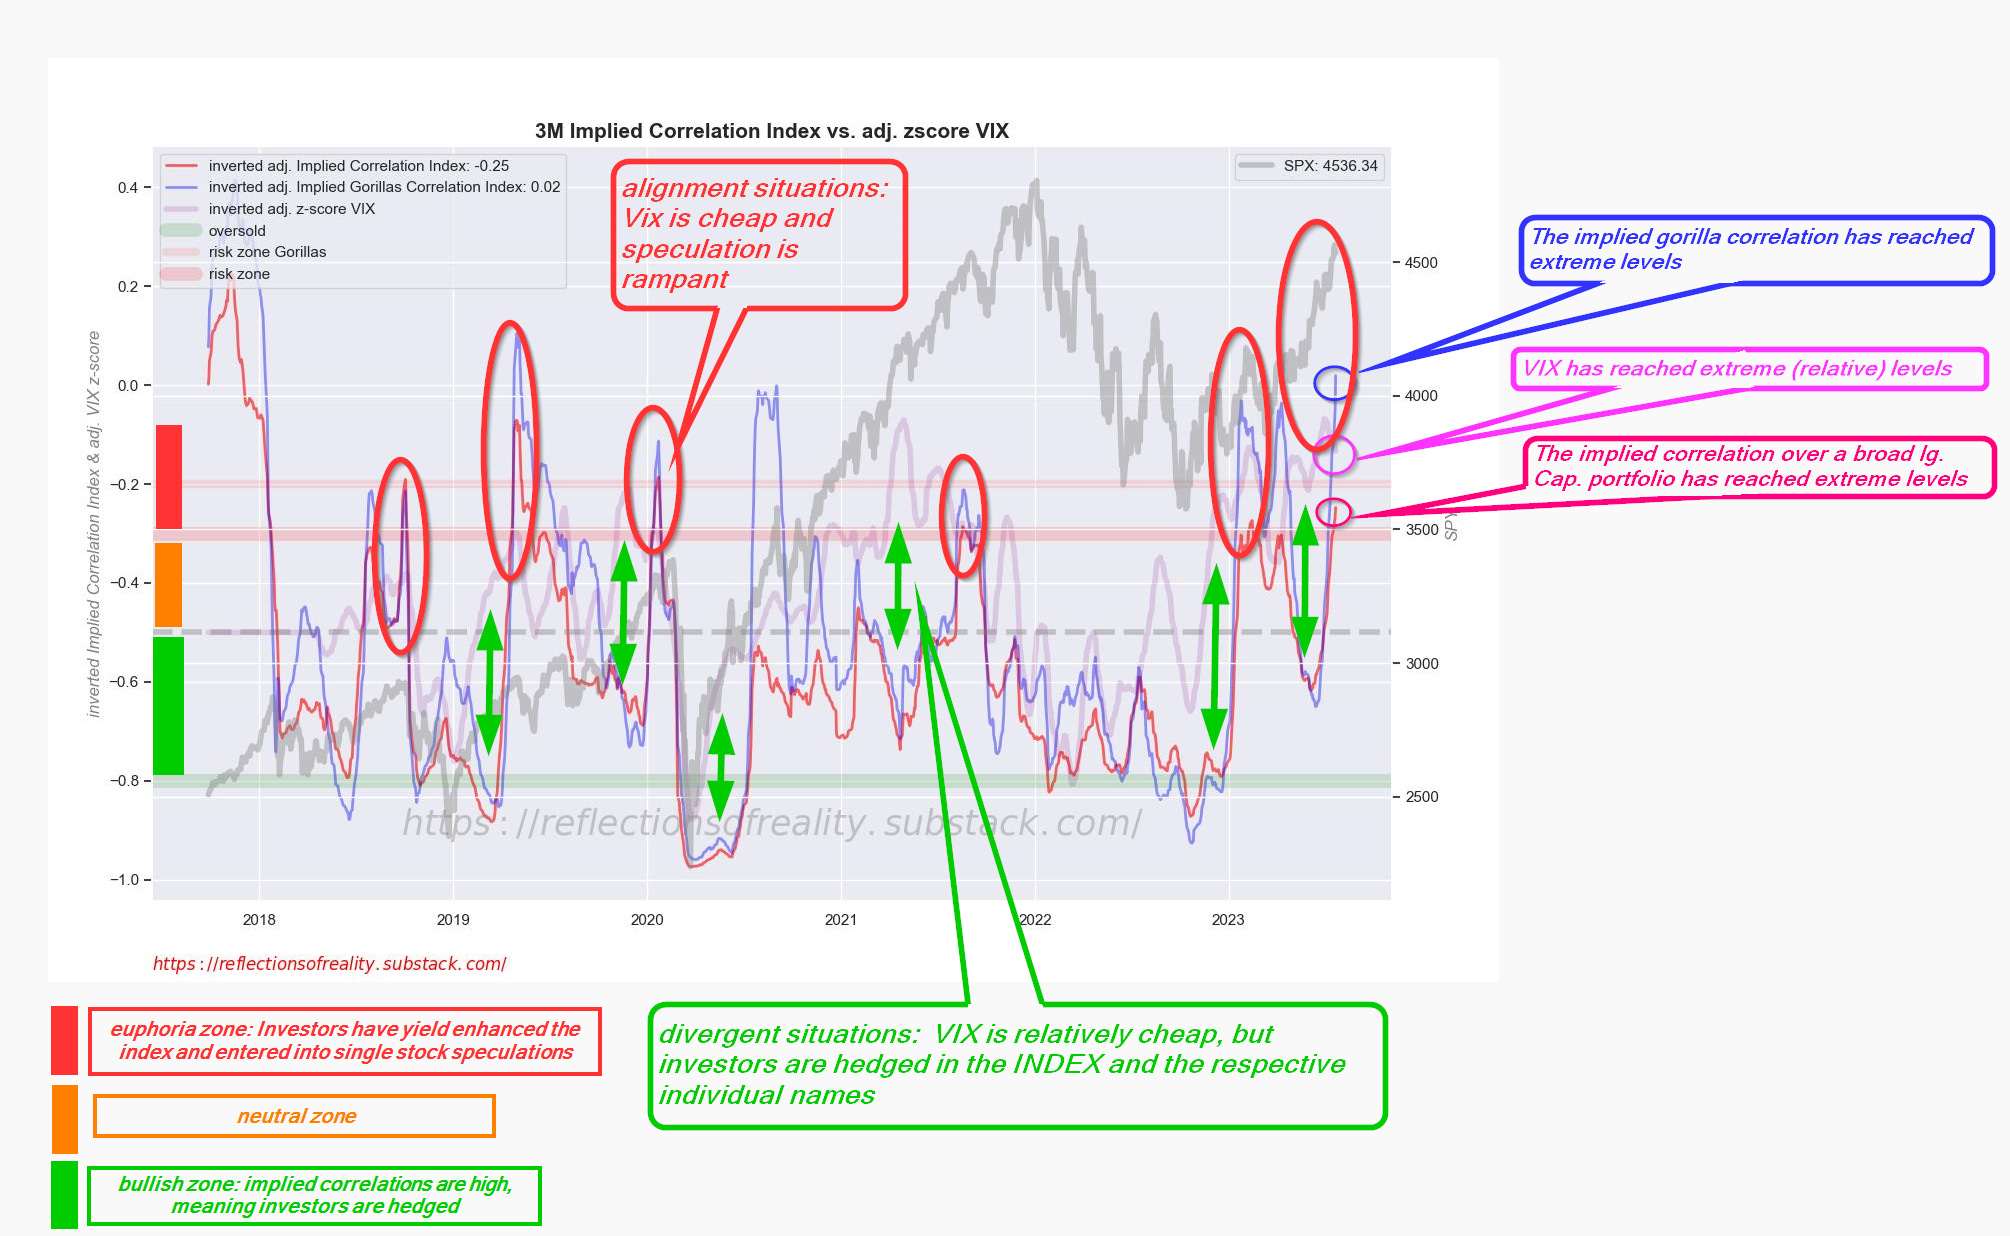
divergent situations:
green implied correlation zone
high VIX (low in our inverted graph)
“melt up” potential
alignment situations:
red implied correlation zone
low VIX (high in our inverted graph)
lead time: 0-3 weeks
high correction risk
Current assessment: ALIGNMENT SITUATION